The top 10 elearning analytics stats to track
3 minute read
Data dashboards are your best friends when it comes to evaluating elearning investment, prototyping ideas and producing content. Good elearning data dashboards update automatically with live user data so that you can have your finger on the pulse. When it comes to analysing elearning success, this is the best place to house your workplace learning analytics. We looked at the top 10 stats you should monitor so you get a full picture of the impact of your learning programs.

10 elearning analytics to track:
- Sessions vs. total users. Are your users coming back for more or just dropping in for a one-hit wonder? Analysing total sessions vs total users give a fuller picture, making it one of the most important elearning analytic stats to keep tabs on.
- Completion rate. Do completion rates matter to your project? If it’s a linear elearning experience, is everyone getting through to the end? If not, why? If it’s a range of performance topics that learners can explore freely, look instead at which pages/topics are visited, and by whom.
- User stats. Are you reaching your target number of users, and in the locations you are aiming for? Do you need to market your product more in certain areas, or help it spread virally?
- Device type. What devices are being used, and how does this differ from your expectations and the way your workplace learning is designed? Can you do more to make it mobile-friendly?
- Session times. This is a great indicator of interest, but also “learning windows.” What might be the optimum topic length?

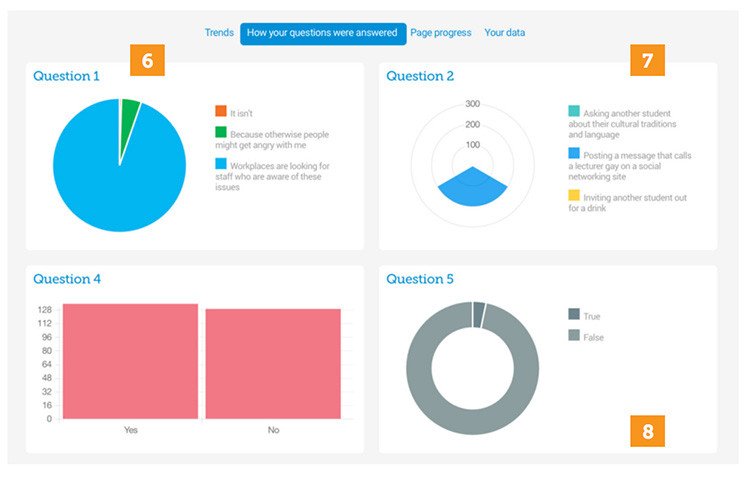
- Poll results. What results are you seeing from polls, and what do they tell you about user attitudes/preconceptions/beliefs? Do these need to be challenged ahead of “learning”?
- Tricky questions. Which really important question are users struggling with? What does this tell you about where they may really be struggling on the job? How can you further help them?
- Easy questions. Which questions are 90 – 100% of users getting right the first time? Were they designed to be that easy, or do you need to make them harder?
- Drop off. What pages are you seeing the total number of users drop off from? Dig deeper to find out why this might be: page errors/lower engagement/less relevant content/navigation or UX issues, or perhaps they simply have all that they need and the rest can be cut!
- User navigation. If you’ve created branches in your content, where are the majority of users going? What does this tell you about their needs/behaviors/profiles?
Note: It’s wise to also look to your learning management system (LMS), surveys, user feedback and real-world performance measures to make sure you get a full picture of the impact of your learning programs.
When are where to use elearning analytics
You should think about using data and learning analytics:
- When planning your workplace elearning content. Are you using data to shape the direction of your digital learning project before you get stuck in the design? Think about previous projects and your audience’s needs, or upskilling and reskilling.
- Once your digital learning content is live. Don’t just launch and forget. Use the learning analytics at your fingertips to continually refine and improve the content, ensuring you’re delivering the most engaging experiences.
- Beyond the project. Make sure you’re balancing data about users and usage of digital learning with your KPIs. This should then feed back into the planning of future projects.
Our latest guide focuses on the fourth C in our 5Cs Framework: Cultivate. In it, you’ll find practical guidance on how to use data to uncover insights and opportunities you can then jump on and use to reap greater returns for your products:
Data is everywhere. Knowing how to use it? Not so much.
Download our guide and start cultivating your digital learning today.
We can help you do it!
Are you looking for ways your team can deliver greater impact? Get started with our ultimate guide, designed to help Learning Leaders crack the data.


